
Exercises Part 1 | Analyzing Neural Time Series Data
4.7 Exercise
4.7.1 Exercises for Script A
Create a 4 × 8 matrix of randomly generated numbers.
Loop through all rows and columns, and test whether each element is greater than 0.5.
Report the results of the test along with the value of the matrix element and its row-column position. For example, your Matlab script should print The 3rd row and 8th column has a value of 0.42345 and is not bigger than 0.5 .
Make sure to add exceptions to print out 1st, 2nd, and 3rd, instead of 1th, 2th, and 3th.
Put this code into a separate function that you can call from the command line with two inputs, corresponding to the number of rows and the number of columns of the matrix.
clear; clc; close all; |
4.7.2 Exercises for Script B
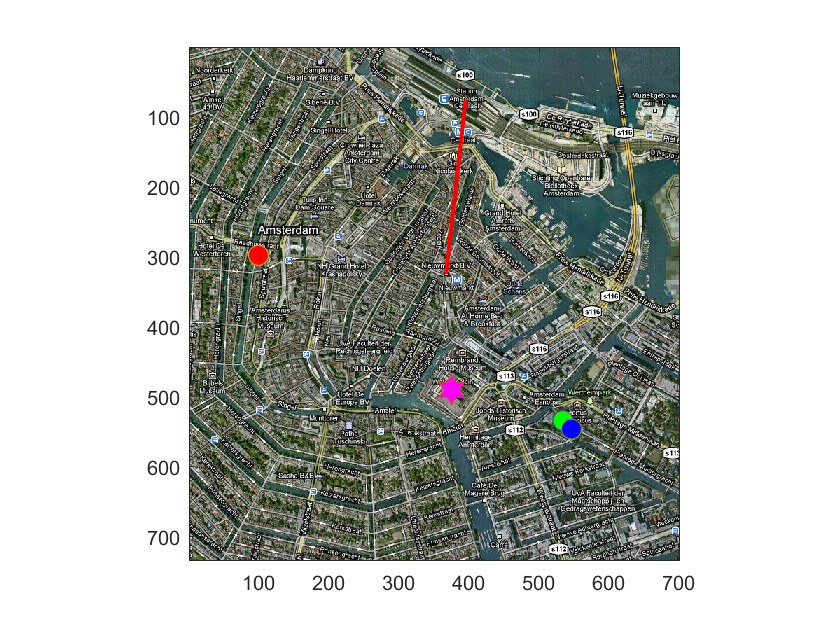
Import and plot the picture of Amsterdam that comes with the online Matlab code.
On top of the picture, plot a thick red line from “ Nieuwmarkt ” (near the center of the picture) to “ Station Amsterdam Centraal ” (near the top of the picture).
Plot a magenta star over the Waterlooplein metro station (a bit South of Nieuwmarkt).
Find the maximum value on each color dimension (red, green, or blue) and plot a circle using that color. There may be more than one pixel with a maximum value; if so, pick one pixel at random.
clear; clc; close all; |
4.7.3 Exercises for Script C
From the function you wrote for exercise 5, generate a 32 × 3 number matrix in which the three numbers in each row correspond to the row, column, and result of the test (1 for bigger than 0.5; 0 for smaller than 0.5).
Write this 32 × 3 matrix to a text file that contains this matrix along with appropriate variable labels in the first row. Make sure this file is tab-delimited and readable by a spreadsheet software such as Microsoft Excel or Open Office Calc.
% 运行该代码前请先运行Exercise_04_A |